completed
Scientific Data Visualization Platform
A local-first platform for exploring scientific datasets through reproducible, accessible, and publication-ready visualizations.
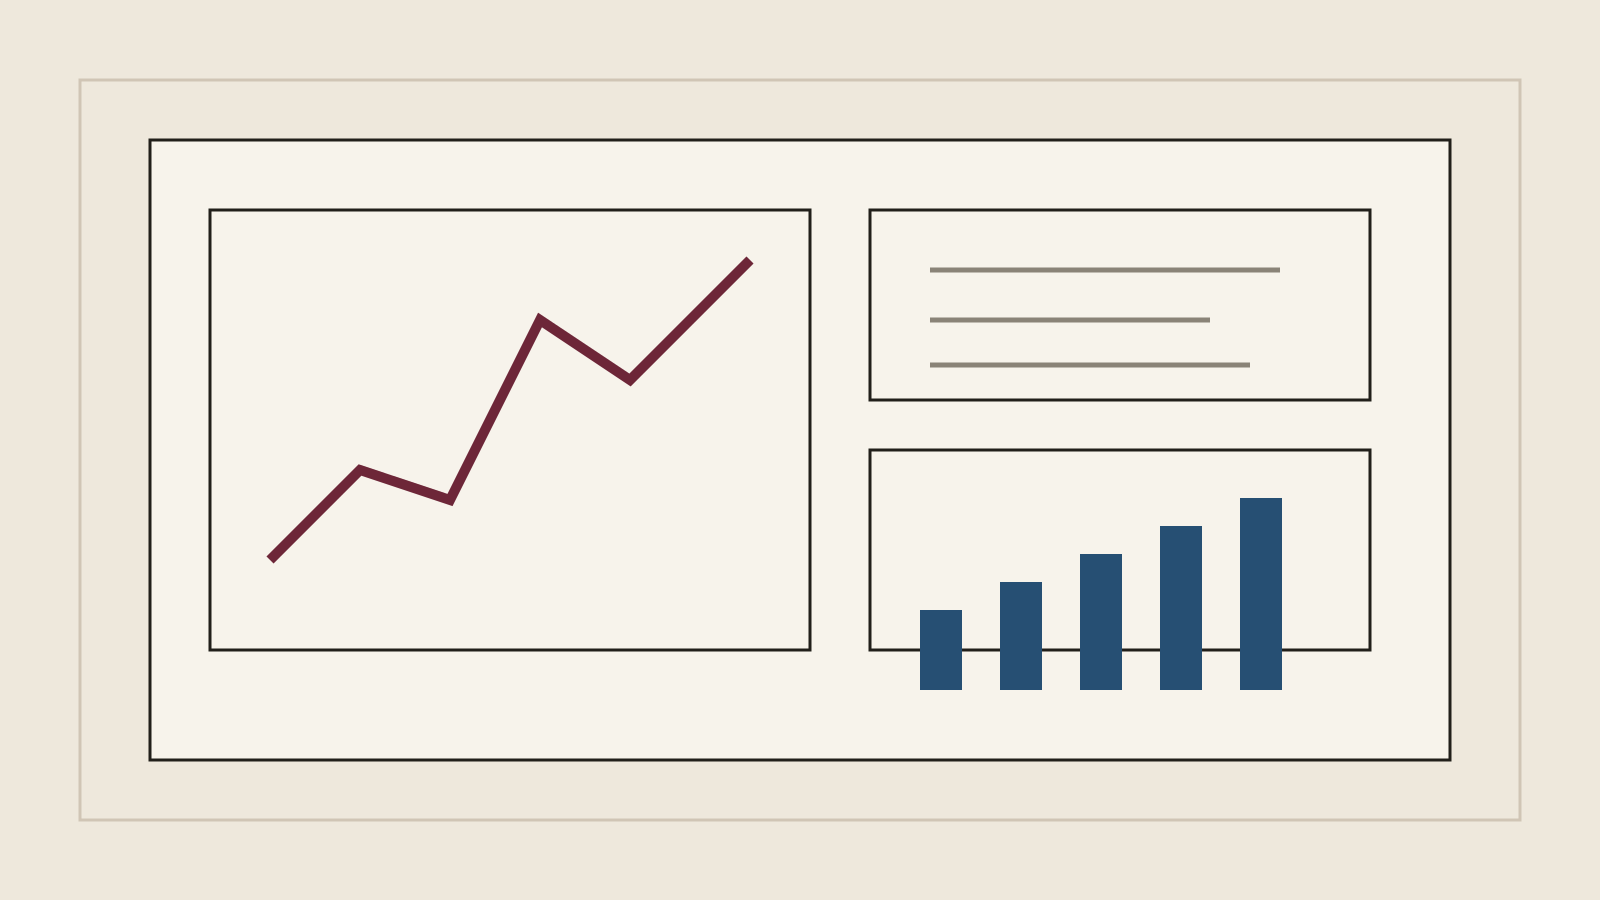
Abstract
The platform tests a simple proposition: exploratory graphics and publishable explanations should share the same data transformations rather than being maintained as separate artifacts.
Context and problem#
Research teams often move between notebooks, spreadsheets, plotting scripts, screenshots, and documents. Each transition can duplicate logic or separate the published figure from the transformation that produced it.
The project organizes datasets, transformations, visual encodings, and explanatory notes inside one typed application. The goal is not to replace specialized scientific tools, but to make common exploratory workflows reproducible and legible.
Architecture#
The application uses server components for dataset discovery and metadata, while interactive chart controls remain isolated client components. Dataset schemas are validated before rendering. Derived summaries are cached during the build, and each visualization can be embedded in an MDX research note.
import { z } from "zod"

export const observationSchema = z.object({
  timestamp: z.string().datetime(),
  variable: z.string().min(1),
  value: z.number().finite(),
  unit: z.string().min(1),
})

export type Observation = z.infer<typeof observationSchema>
Technical decisions#
Typed transformations#
Every transformation receives and returns explicit domain types. This makes unit changes, missing values, and aggregation rules visible in code review.
Progressive enhancement#
The server renders the chart title, description, summary table, and fallback data. Client JavaScript adds brushing, filtering, and tooltips without making the scientific content inaccessible when scripts fail.
Reproducible export#
Figures use the same scale definitions and transformed data in the browser and export pipeline. This reduces discrepancies between exploratory views and publication assets.
Results#
The prototype produced reusable chart compositions, accessible table fallbacks, and MDX case studies that remained understandable outside the interactive interface.
Lessons learned#
The most important architectural boundary was not server versus client. It was scientific transformation versus visual presentation. Keeping those layers separate allowed the same calculation to serve charts, tables, summaries, and tests.